Unsupervised Learning and Dimensionality Reduction
A comparative study of clustering and dimensionality reduction across real datasets, with metric-driven evaluation and runtime profiling.

The Problem: Structure Without Labels
Unsupervised learning starts from a harsher place than most of machine learning.
The data offers no labels, no clean objective, and no guarantee that the patterns you find mean anything at all. All you have are geometry, density, correlation, and the uneasy possibility that an algorithm can produce a beautiful answer to the wrong question.
This project from CS 7641: Machine Learning asks the version of that problem I find most interesting: when labels disappear, how do we tell the difference between real structure and convenient fiction?
Research Questions
- When does K-Means beat EM, and when does EM beat K-Means?
- Which reduction method keeps useful signal while shrinking the feature space?
- How often do quality metrics disagree with runtime reality?
- Can we turn these experiments into a repeatable decision process?
A Quick Way To Think About It
Clustering and dimensionality reduction do different jobs, but they work on the same underlying challenge: making structure visible.
- Clustering asks whether the data naturally separates into groups.
- PCA asks which directions in the data carry the most meaningful variation.
Put together, they offer a way to simplify a dataset without pretending it was simple to begin with.
Experimental Design
I compared methods in a controlled pipeline:
- Clustering: K-Means and Gaussian Mixture Models (EM)
- Dimensionality reduction: PCA, ICA, Random Projection, feature selection
- Evaluation metrics: Silhouette score, Davies-Bouldin score, and wall-clock time
- Cross-dataset validation: test whether conclusions transfer or collapse
This made it easier to separate true algorithm behavior from dataset-specific noise.
Dataset context from the original assignment artifacts:
- Wine dataset: 1,599 rows, 12 attributes (binary target transformation in the assignment workflow)
- Adult Census dataset: 32,561 rows, 15 attributes with encoded categorical variables
Clustering, Clearly
Clustering looks simple until geometry fights back.
- K-Means places centroids and pulls points to the nearest center. It is fast and strong when cluster shapes are compact.
- EM (Gaussian Mixture Models) models each cluster as a probability distribution. It is more flexible when boundaries are fuzzy and overlap is real.
That difference matters. K-Means is decisive and efficient, but it likes neat boundaries. EM is more patient with ambiguity. It can represent overlap, softness, and unequal spread in ways K-Means cannot.
The important lesson from this project is that neither algorithm deserves blind loyalty. Their behavior depends on the shape of the data.
PCA, As a Way of Seeing
PCA is often introduced as a dimensionality reduction algorithm, which is true but incomplete. It is also a way of changing perspective.
High-dimensional data can be difficult to reason about because variation is scattered across too many axes at once. PCA rotates that space so the strongest directions of variation appear first. If those early components capture most of the useful structure, the rest of the analysis becomes easier to interpret.
That is why PCA mattered so much here. It was not just compressing the data. It was exposing a cleaner version of the problem.
ICA and random projection still had value, especially for specific constraints, but PCA was the most reliable default when balancing interpretability, stability, and performance.
What Emerged From the Experiments
Across both datasets, a few conclusions held up repeatedly.
- PCA was the strongest general-purpose reduction method for preserving structure while keeping the analysis interpretable.
- K-Means and EM each had legitimate wins, but their strengths depended on the geometry of the dataset.
- Small values of
kwere often the most defensible once cluster quality and runtime were considered together. - Methods that looked promising on one dataset could become much less convincing on another.
That last point is the one I trust most. In unsupervised learning, the real test is not whether a method can produce an appealing pattern once. It is whether the pattern survives contact with a different dataset.
Cluster Geometry on Wine
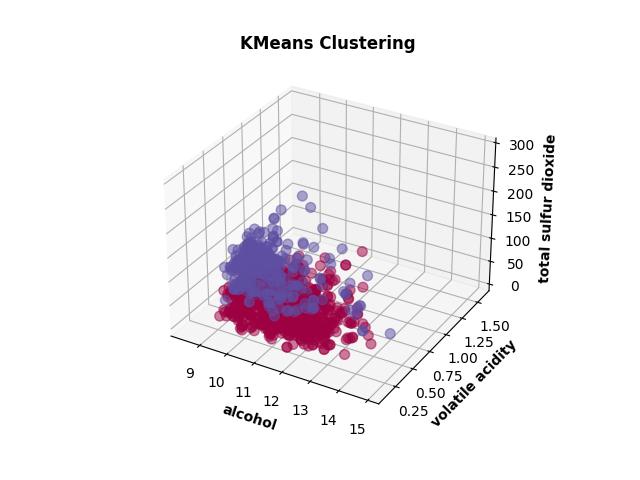
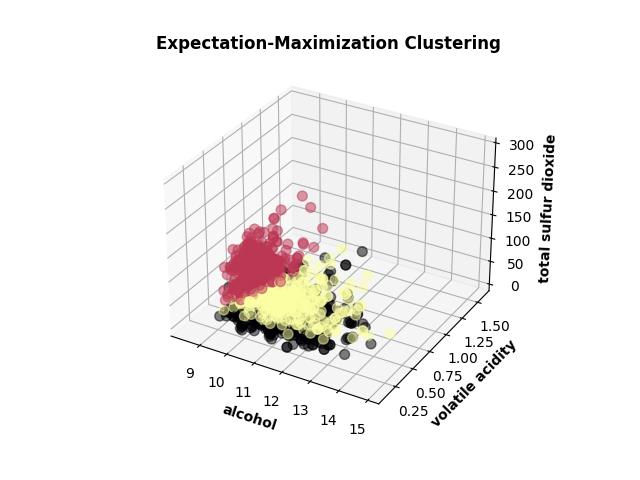
These two views are useful because they reveal the core tradeoff visually. K-Means carves the space into cleaner geometric regions. EM is more comfortable with overlap and softer boundaries. Same dataset, same objective, different assumptions about what a cluster is.
Key Findings
- Algorithm ranking changed by dataset, so fixed preferences were fragile.
- Better reduction did not always mean better clustering, which exposed interaction effects between preprocessing and cluster geometry.
- Runtime profiling changed final recommendations in several cases where metric differences were small.
- Reconstruction behavior was a useful warning signal: when information loss rose too quickly, cluster quality usually degraded next.
- On Wine, PCA and RCA repeatedly outperformed ICA for clustering quality.
- On Census, PCA remained a strong baseline while ICA was more sensitive and often slower.
Why It Matters
The most interesting part of this project was not discovering that one algorithm beat another. It was seeing how quickly “obvious” conclusions fell apart when the dataset changed.
That is why clustering and PCA are worth learning. They force you to think about structure, signal, and representation before you ever get the comfort of prediction accuracy. For someone new to the subject, that is the right lesson to take away: these methods do not reveal truth automatically. They help you form better questions about the data.
Practical Playbook From This Project
- Start with PCA as a baseline reduction strategy.
- Compare K-Means and EM early instead of committing to one family.
- Treat internal metrics as directional signals, not absolute truth.
- Use runtime as a first-class criterion when methods are close in quality.
- Re-check conclusions on a second dataset before calling them general.
Visual Notes
The original assignment included many plots. This portfolio version keeps only a few high-signal visuals and moves the emphasis to interpretation and decision logic.
Artifacts
- Course: CS 7641: Machine Learning
Policy Note
This page shares high-level research outcomes only. Implementation details are kept private to align with course policy.